Redox ratio analysis software
A wealth of fluorescent reporters and imaging systems are now available to characterise dynamic physiological processes in living cells with high temporal and spatial resolution. The most reliable probes for quantitative measurements show shifts in their excitation or emission spectrum, rather than just a change in intensity, as spectral shifts are independent of optical path length, illumination intensity, probe concentration and photobleaching, and can be determined easily by ratiometric measurements at two wavelengths. A number of ratiometric fluorescent reporters, such as roGFP, have been developed that respond to the glutathione redox potential and allow redox imaging in vivo.

roGFP and its derivatives can also be expressed in the cytoplasm or targeted to different organelles giving fine control of measurements from sub-cellular compartments. Furthermore, these probes can be imaged in combination with other probes for physiological parameters such as reactive oxygen species (ROS) or mitochondrial membrane potential, to give multi-channel, multi-dimensional 4-D (x,y,z,t) images. Such approaches are needed to capture transient or highly-spatially localised physiological behaviour from intact, living specimens, which are often not accessible by other biochemical or genetic means. The next challenge is to be able to extract useful data rapidly from such large (GByte) images with due care given to the assumptions used at each step of the image processing.
In response to this need, the programs described here were written to visualise and analyse ratiometric changes in fluorescence of the dual-excitation redox sensitive protein, roGFP and its derivatives, expressed in transgenic cell cultures, plants and fungi, alongside other physiological parameters, such as ROS or mitochondrial activity, in multi-dimensional 4-D (x,y,z,t) images. Whilst developed for redox imaging, in practice, the programs can also used to quantify fluorescent signals from any ratiometric (or single-wavelength) probe in any system.
If you find the software useful please cite:
Fricker, M.D. (2016) Quantitative Redox Imaging Software. Anti-Oxidant and Redox Signalling 24: 752-762. doi:10.1089/ars.2015.6390. pdf
Examples of the use of the software can be found in:
Fuchs, R. Kopischke, M., Klapprodt, C. Hause, G., Meyer, A., Schwarzländer, M. Fricker, M.D. and Lipka, V. (2016) Immobilized subpopulations of leaf epidermal mitochondria mediate PEN2-dependent pathogen entry control in Arabidopsis. Plant Cell, 28, 130-145 http://dx.doi.org/10.1105/tpc.15.00887
Wagner, S., Behera, S., De Bortoli, S., Logan, D., Fuchs, P., Carraretto, L., Teardo, E., Cendron, L., Nietzel, T., Füßl, M., Doccula, F., Navazio, L., Fricker, M., Van Aken, O., Finkemeier, I., Meyer, A., Szabo, I., Costa, A., and Schwarzländer, M. (2015) AtMICU choreographs mitochondrial Ca2+ dynamics in Arabidopsis. Plant Cell 27, 3190-3212. Doi: 10.1105/tpc.15.00509
Wagner, S., Nietzel, T., Aller, I., Costa, A., Fricker, M.D., Meyer, A.J. and Schwarzländer, M. (2015) Analysis of plant mitochondrial function using fluorescent protein sensors. Methods in Molecular Biology 1305, 241-252. Doi: https://doi.org/10.1007/978-1-4939-2639-8_17
Schwarzländer, M., Wagner, S., Ermakova, Y. G., Belousov, V. V., Radi, R., Beckman, J. S., Murphy, M. P. (2014). The ‘mitoflash’ probe cpYFP does not respond to superoxide. Nature, 514(7523), E12-E14. Doi:10.1038/nature13858
Samalova, M., Meyer, A. J., Gurr, S. J., & Fricker, M. D. (2014). Robust anti-oxidant defences in the rice blast fungus Magnaporthe oryzae confer tolerance to the host oxidative burst. New Phytol., 201, 556-573. doi:10.1111/nph.12530. pdf
Schwarzländer, M., Murphy, M. P., Duchen, M. R., Logan, D. C., Fricker, M. D., Halestrap, A. P., Sweetlove, L. J. (2012). Mitochondrial ‘flashes’: a radical concept repHined. Trends Cell Biol, 22, 503-508. Doi:10.1016/j.tcb.2012.07.007
Schwarzländer, M., Logan, D. C., Johnston, I. G., Jones, N. S., Meyer, A. J., Fricker, M. D.,Sweetlove, L. J. (2012). Pulsing of membrane potential in individual mitochondria: a stress-induced mechanism to regulate respiratory bioenergetics in Arabidopsis. Plant Cell, 24, 1188-1201. Doi:10.1105/tpc.112.096438
Schwarzländer, M., Logan, D.C., Fricker, M.D., & Sweetlove, L.J. (2011). The circularly permuted yellow fluorescent protein cpYFP that has been used as a superoxide probe is highly responsive to pH but not superoxide in mitochondria: implications for the existence of superoxide ‘flashes’. Biochem J, 437, 381-387. Doi:10.1042/BJ20110883
Schwarzländer, M., Fricker, M. D., Müller, C., Marty, L., Brach, T., Novak, J.,Meyer, A. J. (2008). Confocal imaging of glutathione redox potential in living plant cells. J Microsc, 231, 299-316. Doi:10.1111/j.1365-2818.2008.02030.x
Meyer, A.J. and Fricker, M.D. (2008). Imaging thiol-based redox processes in live cells. In: Sulfur Metabolism in Phototropic Organisms. Ed: C. Dahl, R. Hell, D. Knaff, T. Leustek. pp. 483–501. ISBN: 1402068638, 9781402068638
Overview of the software
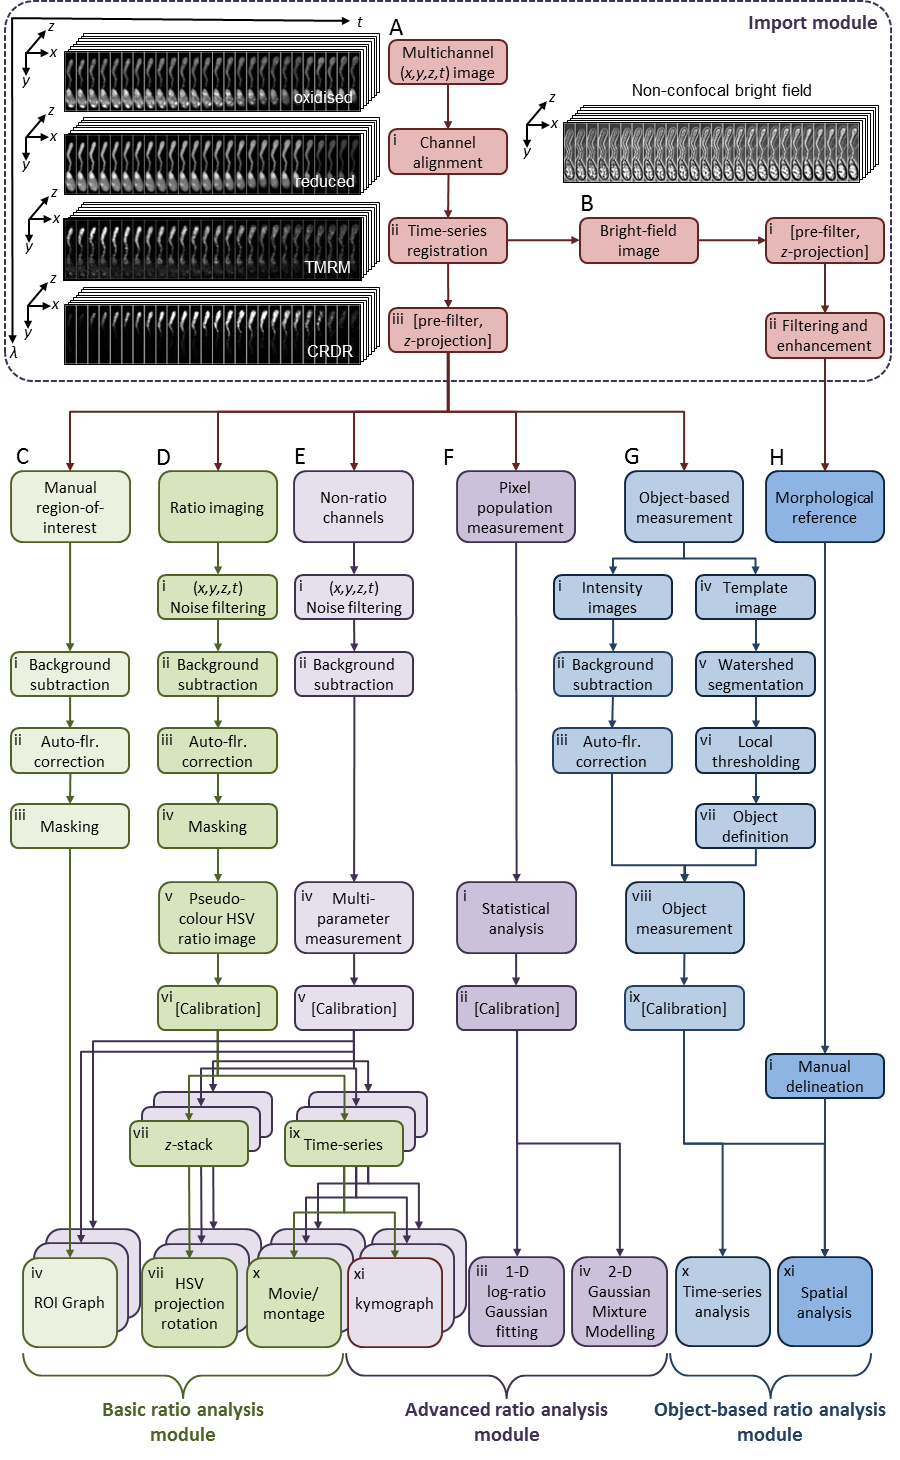
An overview of the software is presented in the schematic diagram below. Multi-channel, multi-dimensional images are loaded using the import module (red boxes), aligned, filtered and, if appropriate, the dimensionality reduced using projection algorithms. The Basic Ratio Analysis module (green boxes) is used to construct pseudo-colour coded ratio images, following background subtraction and auto-fluorescence correction. Measurements are made using manually defined regions-of-interest (ROIs). The Advanced Ratio Analysis module (purple boxes) extends the analysis to include multiple channels, and provides additional visualisation approaches, such as kymograph plots. There are also options to analyse the whole population of pixels using 1-D fits to the log-ratio data or 2-D Gaussian Mixture Models fit to the corrected intensity data. The Object-based Ratio Analysis module (blue boxes) uses a watershed segmentation, followed by a local intensity threshold to identify individual objects. The ratio values are then calculated from the average intensity for each object. The object ratios can be analysed as a population response, or combined with morphological information, such as cell identity or with distance from a spatial landmark, to correlate the redox behaviour with the cell response.