Analysis of the Physarum networks
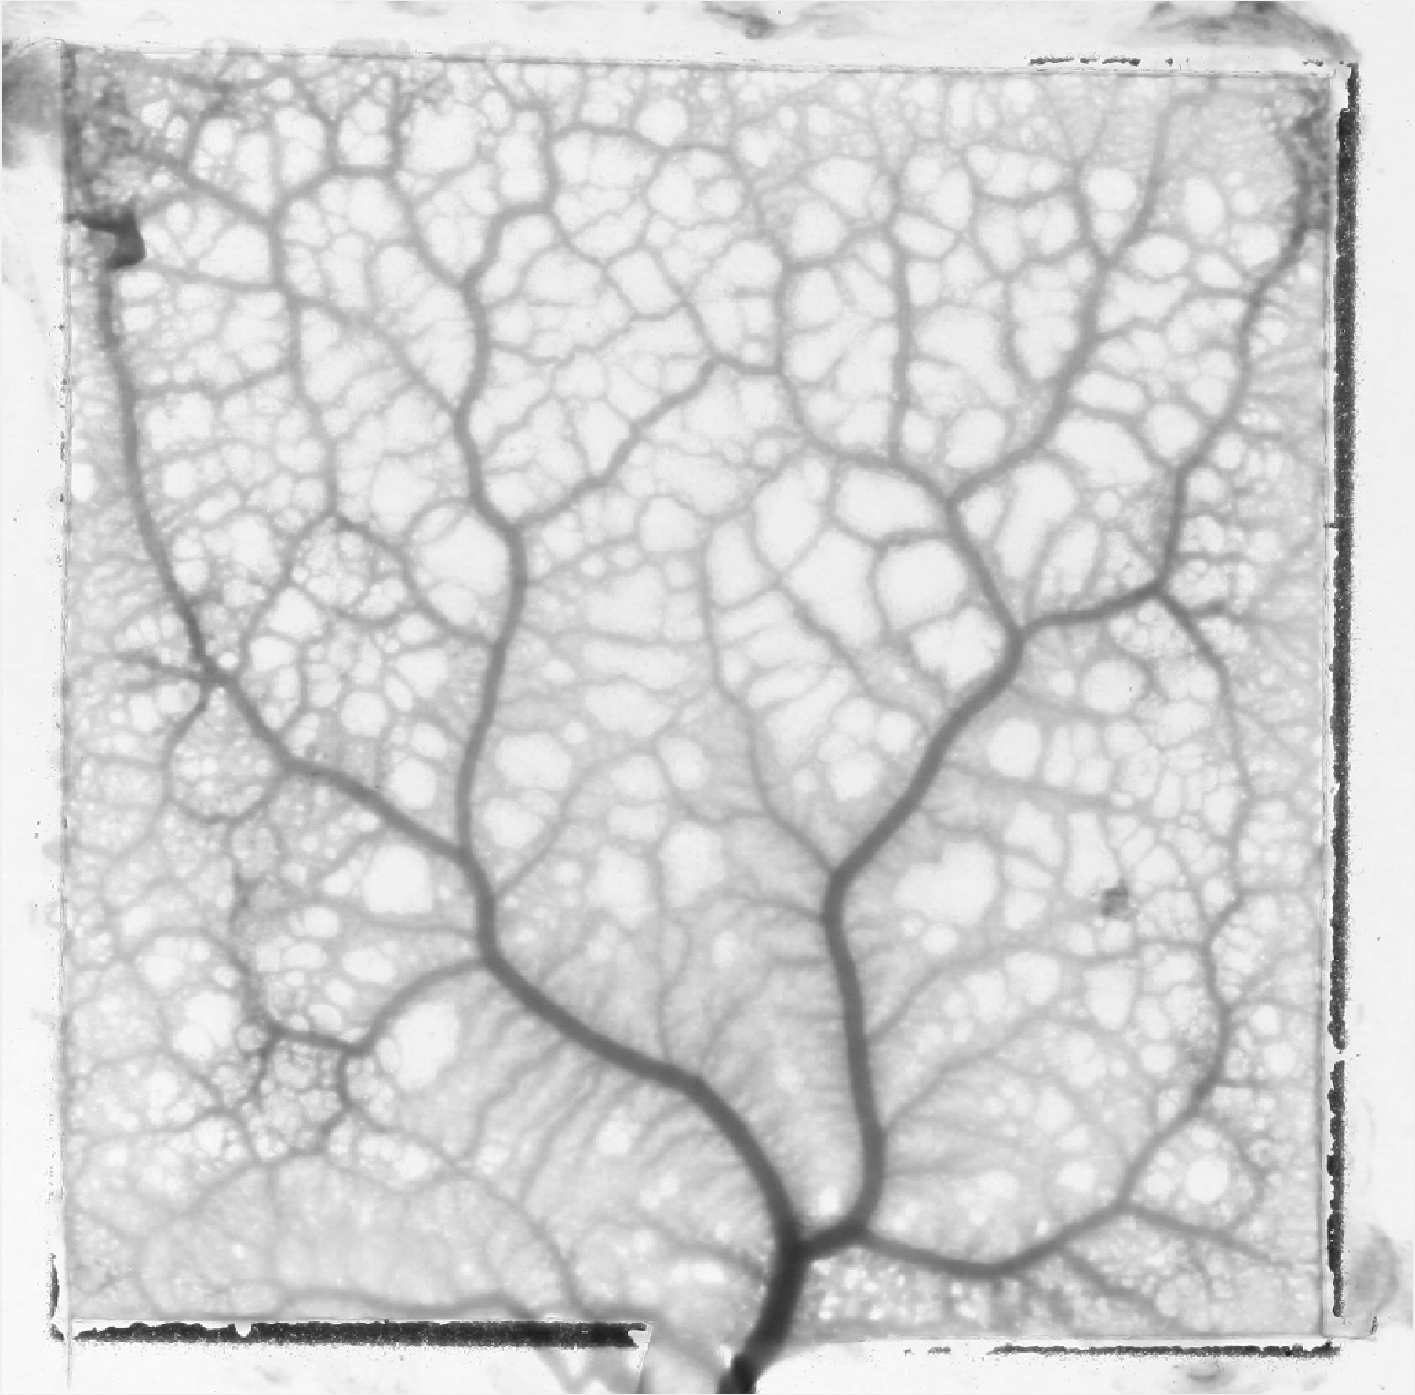
The programs were originally designed to quantify the network structure of Physarum polycephalum plasmodia growing across agar surfaces or evacuating from a constrained arena. Fully quantitative measurements use transmission imaging to estimate the thickness of the plasmodium using the Lambert-Beer law. The program can determine:
- The length and width of the veins;
- The topological organisation of the network;
- The predicted hydraulic conductivity and accessibility;
- The predicted flow on the network from a (short) time-series, including adjustment for the intervening plasmodial sheets;
- The size and shape of the polygonal regions enclosed by the network;
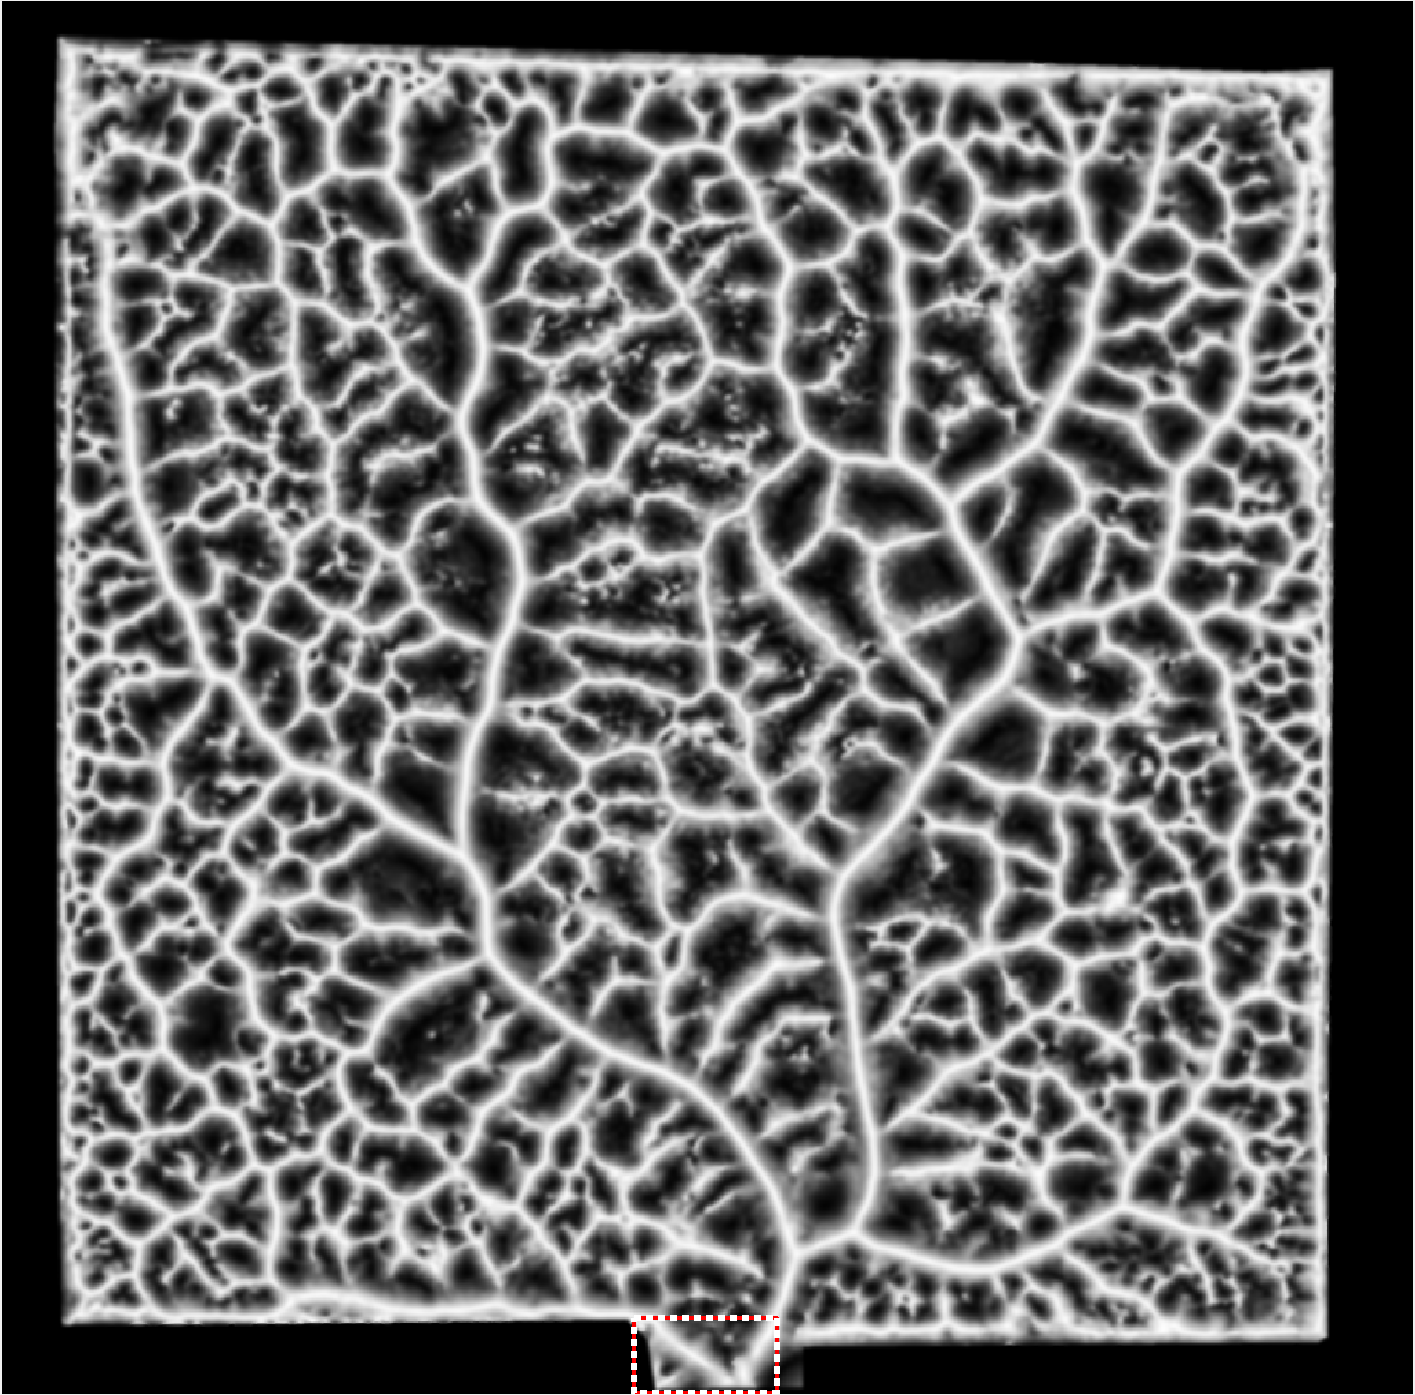
Topological measures of the network structure can also be extracted following conversion of the pixel skeleton to a weighted, un-directed graph, where nodes represent junctions and edges represent the veins that connect them. A range of graph-theoretic measures are then calculated, including predicted transport efficiency and betweenness centrality.The simplest method to identify the network would be an intensity-based segmentation of the transmission image to give a binary image, with ones representing the veins and zeros for the background. However, the resultant binary image is critically dependent on the value for the threshold used, and it is rare that a single threshold provides adequate segmentation without either losing dimmer structures if it is set too high, or artificially expanding and fusing adjacent regions if it is set too low. This is particularly problematic with developing networks in Physarum, as the veins form from retraction of the intervening plasmodial sheets, which make segmentation difficult until a well delineated network is present. Thus the approach adopted here exploits additional intensity-independent information over a range of scales and orientations to enhance the network structure, prior to segmentation as a single-pixel wide skeleton. The skeleton is then used as a template to interrogate the image locally to provide an estimate of the relative amount of plasmodium present and to provide an indication of the vein or sheet width.
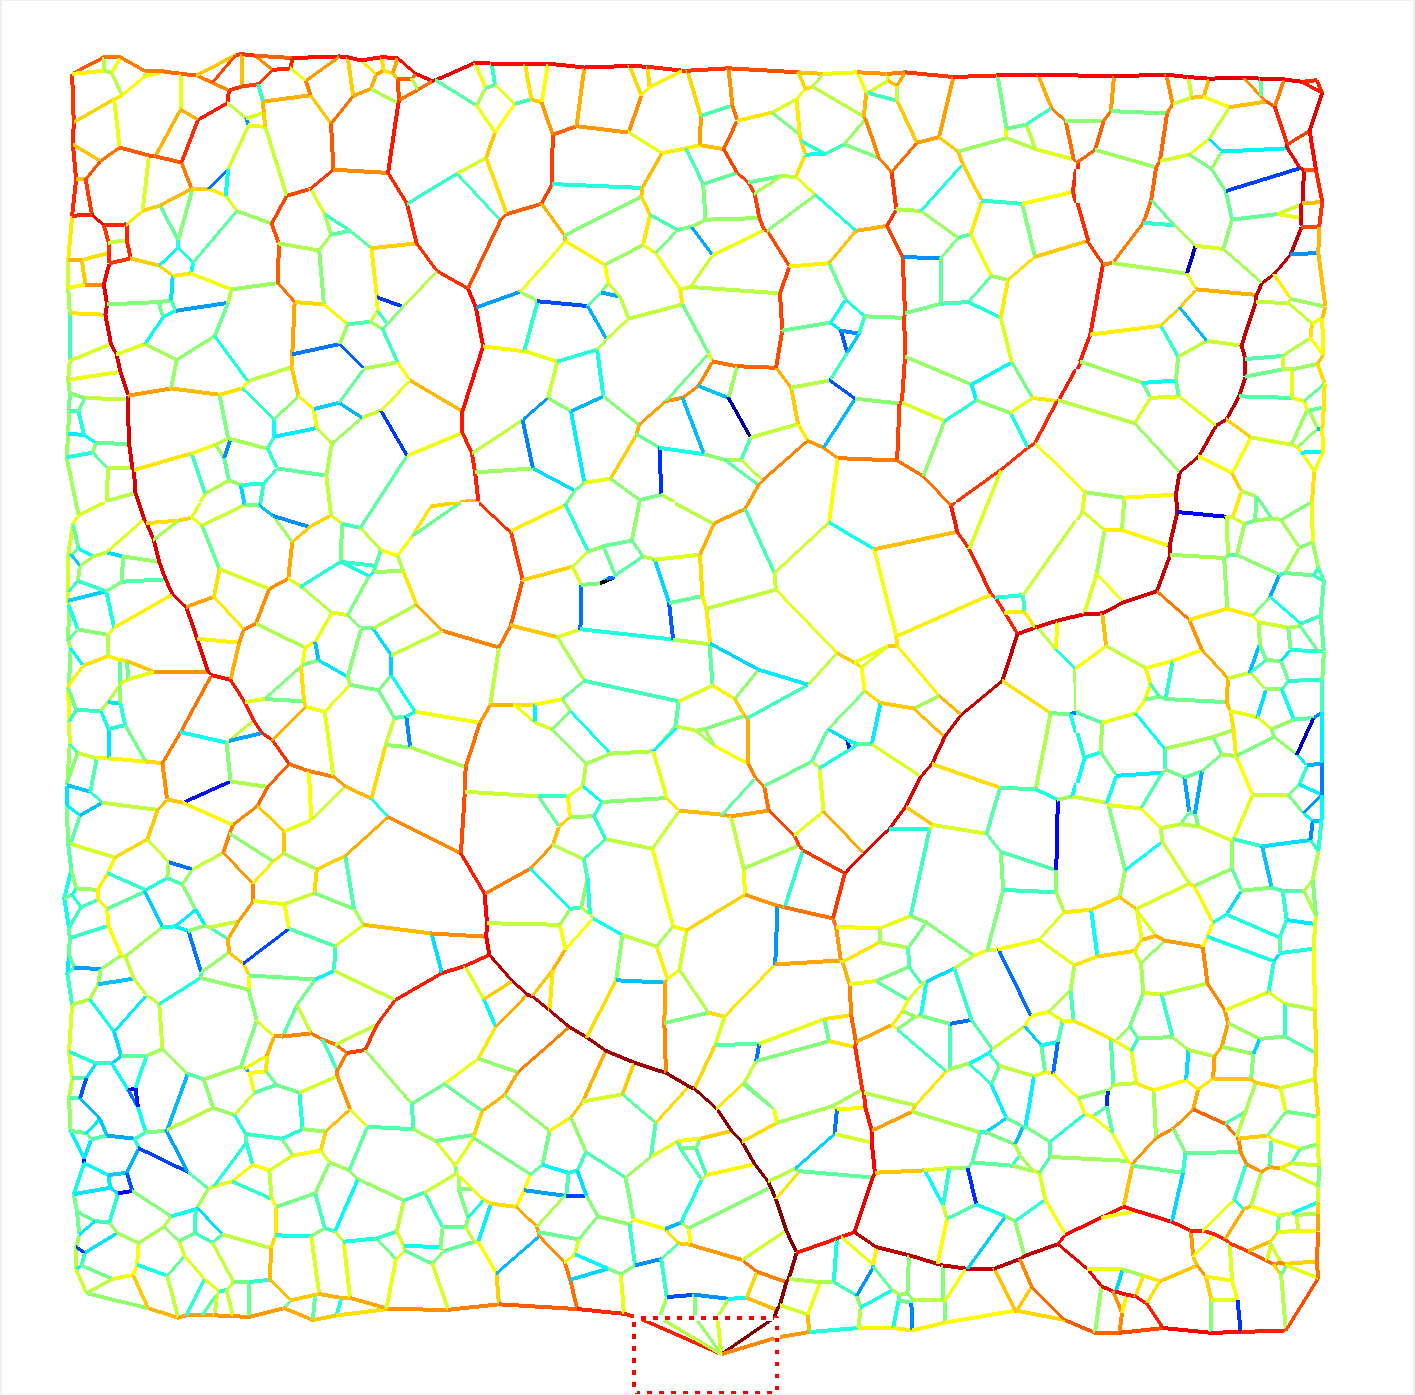
predicted current
predicted current 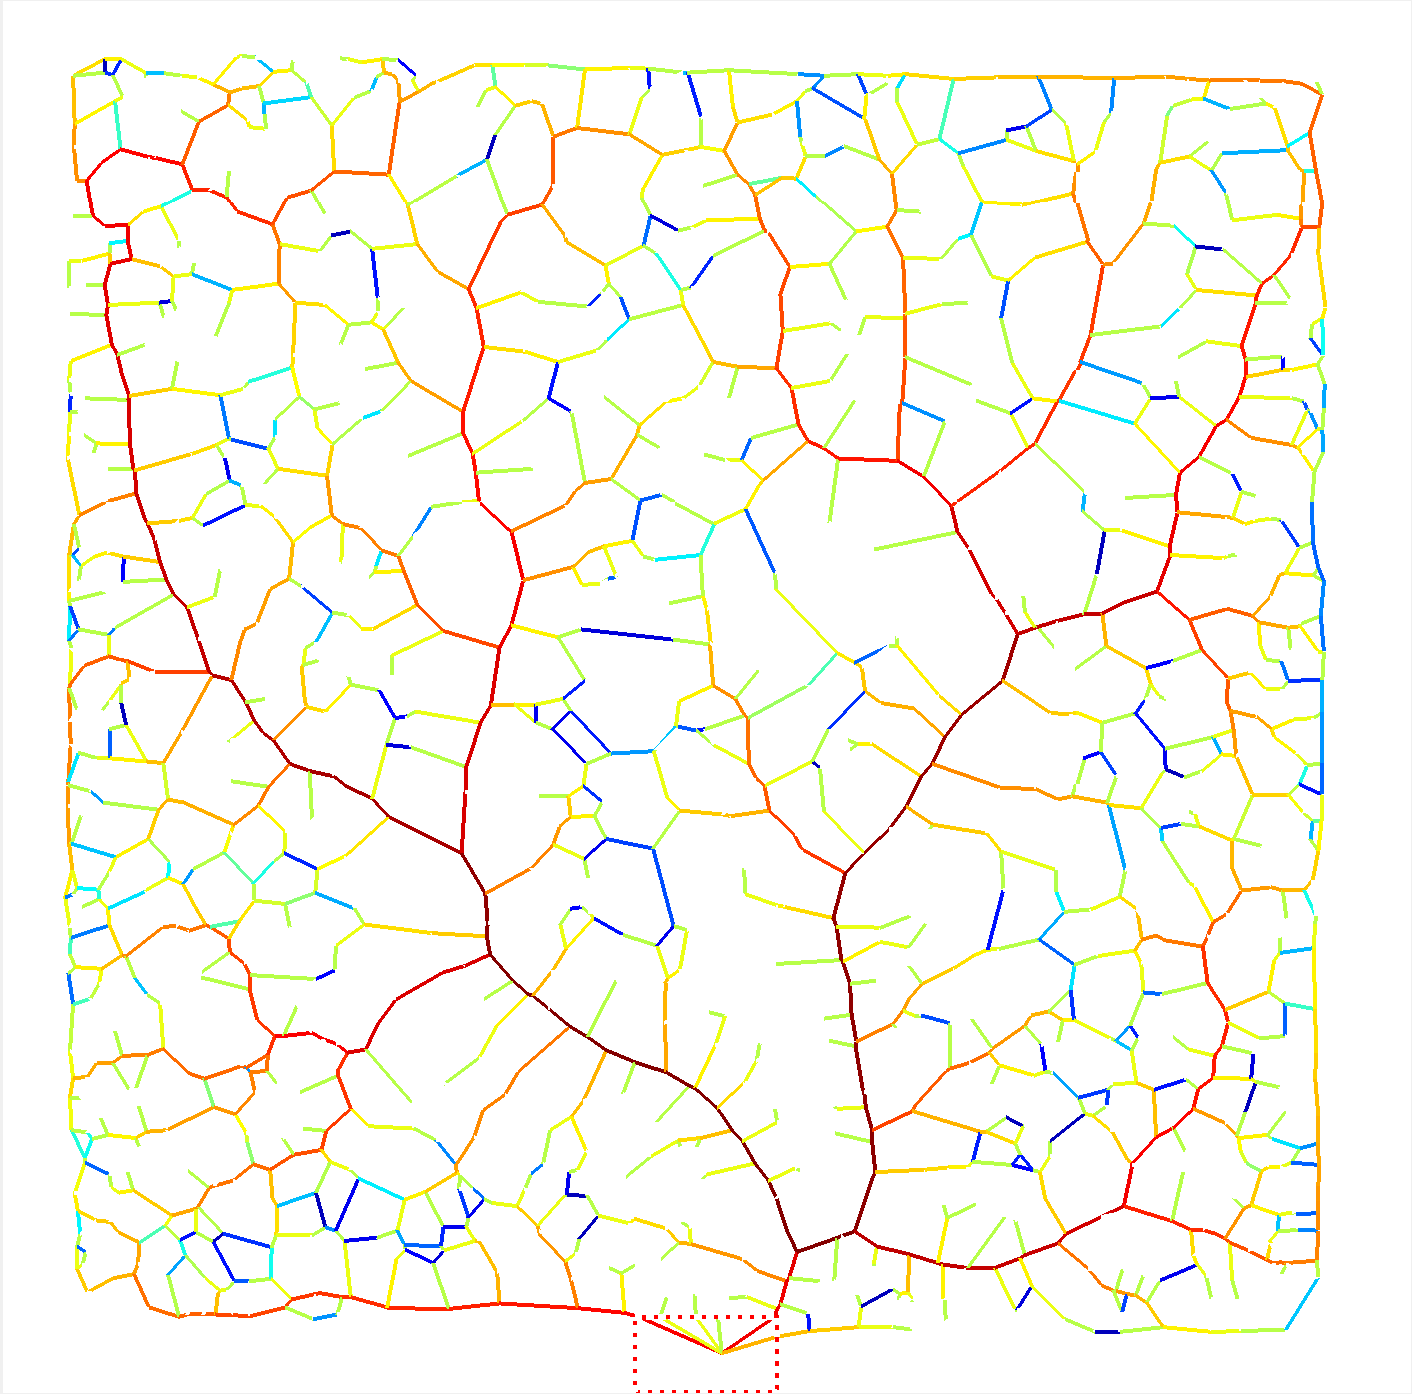
betweenness centrality
If the initial data is a time series and the entire network has been captured, it is possible to predict the flows in the network from the changes in volume in each edge (and adjacent plasmodial sheet) . This allows comparison of network structure, predicted flow and models, such as Murray’s Law.
Fricker, M.D., Akita, D., Heaton, L.L.M., Jones, N., Obara, B. and Nakagaki, T. (2017) Automated analysis of Physarum network structure and dynamics. J. Phys. D: Appl. Phys. 50, 254005. Link
