AnalyzER: Quantitative analysis of plant ER architecture and dynamics
The endoplasmic reticulum (ER) forms a complex and dynamic network of tubules and sheet-like cisternae that ramify throughout the cytoplasm (Fig. 1). This software package is designed to quantify ER organisation in plant epidermal cells, where the ER is confined to a very thin layer of cytoplasm appressed to the periclinal cell wall as a planar, 2-D network. The input image typically comprises single plane (x,y) confocal fluorescence images of ER-targeted fluorescent proteins (Fig. 2).
|
|
|


The aim of the AnalyzER program is to quantify:
- The length, width, morphology and protein distribution along the ER tubules;
- The degree and branch angles at junctions (nodes) in the tubular network;
- The size, shape and protein distribution in cisternal sheets and around the perimeter of the cisternae;
- The topological organisation of the tubular and cisternal network determined using graph-theoretic metrics;
- The distribution of immobile nodes, tubules and cisternae using persistency mapping;
- The local speed and direction of movement of tubules and cisternae using optical flow;
- The size and shape of the polygonal regions enclosed by the network;
Overview
The simplest method to identify the ER automatically would be an intensity-based segmentation of the fluorescent image to give a binary image, with ones representing the ER structure and zeros for the background. However, the resultant binary image is critically dependent on the value for the threshold used, and it is rare that a single threshold provides adequate segmentation without either losing dimmer structures if it is set too high, or artificially expanding and fusing adjacent regions if it is set too low. Thus the approach adopted here exploits additional intensity-independent information over a range of scales and orientations to enhance the network structure, prior to segmentation as a single-pixel wide skeleton. The skeleton is then used as a template to interrogate the image locally to provide an estimate of the relative amount of fluorescent probe present and to provide an indication of the tubule width.
The expected width of the ER tubule is only 50-70nm, which is below the resolution of the confocal microscope, but can just be resolved with super-resolution techniques, such as stimulated emission depletion microscopy (STED). For most laboratories, access to super-resolution techniques may be limited, necessitating the development of approaches that can be used on a routine basis with existing tools. Thus, with additional assumptions about the distribution of the fluorescent lumenal marker and the point-spread-function (psf) of the microscope, the width of the ER can be estimated, even if this is below the resolution limit of the microscope system. We have implemented some basic routines to estimate the relative tubule width convolved with the psf, and also introduced additional measures using the intensity values to infer the actual sub-resolution tubule width.
Topological measures of the ER network structure can also be extracted following conversion of the pixel skeleton to a weighted, un-directed graph, where nodes represent junction points and edges represent the tubules that connect them. Unlike morphological measurements, the topology of the network is less sensitive to the resolution of the imaging system as it reflects the connectivity of the ER rather than the physical size of the components.
The AnaylzER package
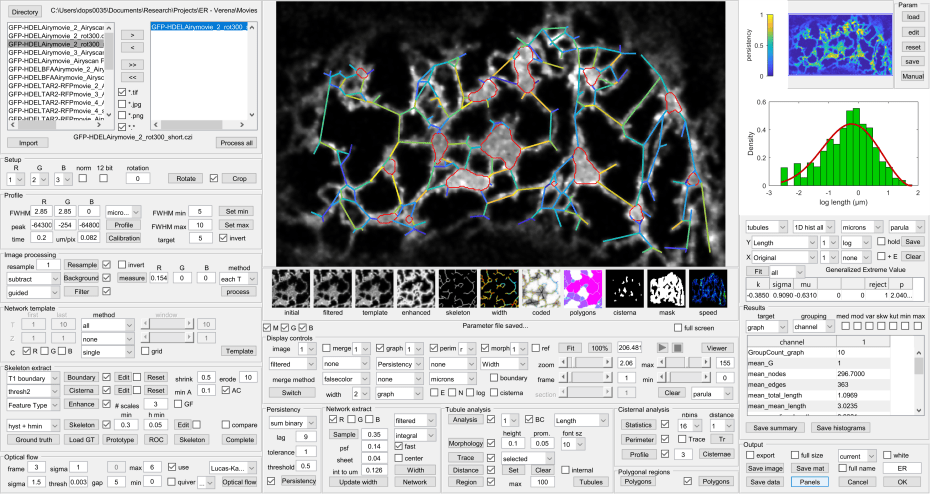
The AnalyzER package is implemented in MatLab and available from the download link as a MatLab app for MatLab 2017a or later, or as a standalone package for Windows 10. All aspects of the analysis are handles through a single graphical user interface (Fig. 3) to provide an integrated platform.
References
Pain, C., Kriechbaumer, V., Kittlemann, M., Hawes, C. and Fricker, M.D. (2019) Quantitative analysis of plant ER architecture and dynamics. Nature Communications 10, 1-15. Doi: 1038/s41467-019-08893-9
Breeze, E., Dzimitrowicz, N., Kriechbaumer, V. Brooks, R., Botchway, S.W., Brady, J.P., Hawes, C., Dixon, A., Schnell, J.R., Fricker, M.D. and Frigerio, L. (2016) A C-terminal amphipathic helix is necessary for the in vivo tubule-shaping function of a plant reticulon. PNAS Doi 10.1073/pnas.1605434113
